


The Digital Discovery Assessment (DDA) is used in the sales cycle to assess a customer's requirements and match them with the best SAP S/4HANA Cloud solution to fit their needs. This occurs in the Discover phase of the SAP Activate Methodology.

The Digital Discovery Assessment (DDA) is used in the sales cycle to assess a customer's requirements and match them with the best SAP S/4HANA Cloud solution to fit their needs. This occurs in the Discover phase of the SAP Activate Methodology.
To make an SAP S/4HANA Cloud implementation successful, we need to move away from the traditional "Fit-Gap" on-premise mindset to the Fit-to-Standard Cloud mindset. The purpose of the Fit-to-Standard Analysis workshops is to confirm the scope identified in the Digital Discovery Assessment and gather configuration and customization requirements. To do this, implementation consultants demonstrate the SAP S/4HANA Cloud business processes to customer experts from each line of business.
Dawn Watts is an experienced SAP consultant and founder of Guided Tech Solutions: An SAP consulting company specializing in SAP Finance & Controlling. Dawn has led SAP project implementations and support teams in Finance & Controlling for 2 decades. She has experience working with financial, customer service, and manufacturing teams in the telecommunications, medical devices, flooring, industrial, life sciences, and energy industries.
SAP Central Business Configuration (SAP CBC) is a new tool that is used to configure a business process spanning different SAP cloud solutions from one central place. SAP CBC allows you to manage your configurations for SAP cloud implementations and ongoing operations centrally through Project Experience. We can initiate change anytime to make additions to your scope and organizational structure or make changes to existing configuration settings.
In S/4HANA 2022, SAP introduced a tool called “Organizational Flexibility in Financial Accounting” (also called “Organizational Change” or “Profit Center Reorganization”) which enables the changing of legal and management entities that are grouped according to organizational structures, master data and transactional data. This feature allows you to update the profit center assignment in master data, such as Materials, Assets, WBS Elements CO Orders, and creates transfer postings for selected balance sheet accounts and open payables and receivables. Watch this recorded webcast with SAP FI/CO Expert Paul Ovigele to learn the following:
- The various scenarios where Profit Center Reorganization is needed.
- How to use the “Manage Organizational Changes” app is to help you to split, combine, and replace profit centers.
- Which SAP Objects are affected by the reorganization.
- How you can navigate to related apps for organizational changes.
- Limitations of the “Organizational Flexibility in Accounting” feature.
The Digital Discovery Assessment (DDA) is used in the sales cycle to assess a customer's requirements and match them with the best SAP S/4HANA Cloud solution to fit their needs. This occurs in the Discover phase of the SAP Activate Methodology.
This article will discuss an overview of analytics in the modern SAP digital economy, SAP's embedded analytics Strategy, the VDM model, and examples and use cases of Embedded Fiori Applications.
The Modern SAP Digital Economy
SAP’s Embedded Analytics Strategy
The VDM model
Use Cases For Embedded Fiori Applications
Customers moving to SAP S/4HANA come from different backgrounds and have different end goals. RISE with SAP is designed to address unique customer scenarios. RISE is not a system upgrade, it's a redesigned method of working that allows customers to change not only once, but to continuously transform. Rise with SAP simplifies a customer's move to the cloud and helps throughout their business transformation journey. RISE with SAP delivers seamlessly with SAP partners, Hyperscaler partners, the Reseller community, and Software partners. RISE with SAP is designed to help SAP customers.
Learn about the history of how SAP software has evolved over the last five decades. Topics will include CO FI Real Time Integration example in ECC; Changes brought in by HANA, cloud and various acquisitions; Important design and configuration changes for Controlling in S/4HANA; Cost Elements are now part of G/L Account; Material Ledger is mandatory in S/4HANA; Cost components and variances break down can now flow to Financial Accounting; Move towards Margin Analysis and Other Features and Innovations.
The SAP S/4 HANA Finance Group Reporting module is SAP’s latest financial consolidation reporting tool which streamlines month-end close processes by unifying operational entity and financial consolidation group close processes. The new group reporting logic was implemented as of S4 HANA 1909. The new group reporting logic includes a set of features to support legal and management consolidation
SAP Margin Analysis (previously known as Account Based CO-PA) allows organizations to gain insights into their margins, revenues, and costs of specific market segments such as products, customers, material groups and other dimensions. The goal is to provide management with contribution margin information to aid in the decision-making process. With S/4HANA, you can perform Profitability Analysis using both the Costing-based CO-PA and Margin Analysis methods. SAP recommends Margin Analysis as the default solution even though both Costing-based and Margin Analysis can co-exist. This is because, only the Margin Analysis solution updates the universal journal (ACDOCA), and all future innovations will only be made for Margin Analysis.
By now, everyone has heard about some of the major changes that occur in S/4HANA Finance, such as the Universal Journal, New Asset Accounting, mandatory Material Ledger, and so on. A huge difference between S/4HANA Finance and ECC, is the merging of the Financial Accounting (FI) and Controlling (CO) modules (the proverbial “Single Source of Truth”), and most of the Controlling functionalities are now subsumed into the Universal Journal.
One of the most misunderstood aspects in all of SAP is how to analyze production variances. This is partly because SAP’s method of Product Cost Controlling is different from other accounting software systems, in that production costs are passed through the P&L as well as the Balance Sheet. And also, because production activity (Labor, Machine Time, Overhead) is tracked using Secondary Cost Elements, which are not part of your typical Financial Statements. Even some of the most seasoned cost accountants are flummoxed with how the manufacturing information is represented in Financial and Management Accounting, and how to measure price and efficiency variances. To put it simply, Production Variance Analysis involves three steps:
Creating a standard cost estimate, which calculates the expected cost to manufacture an assembly.
Collecting the Actual manufacturing costs on a manufacturing order (production order/process order /product cost collector).
Calculating the Variance, which is the difference between:
actual costs: components, labor, overhead
actual credits: value of finished goods manufactured.
- Look into the design aspects that are jointly owned by CO, MM and PP teams. (e.g. Resource / Work Center and their Standard Value Keys, Formulae for Activity Types).
- Review options to add freight, other incidental costs in the standard cost estimates and track actuals (e.g. Costing Sheet, Additive Costs, User exit for material valuation, Accrual pricing conditions in Purchase Order, etc.)
- Understand how to investigate and rectify messages encountered during product costing
- Deep dive into movement types and account determination, analyze MM-FI accounting flow
One of the most misunderstood aspects in all of SAP is how to analyze production variances. This is partly because SAP’s method of Product Cost Controlling is different from other accounting software systems, in that production costs are passed through the P&L as well as the Balance Sheet. And also, because production activity (Labor, Machine Time, Overhead) is tracked using Secondary Cost Elements, which are not part of your typical Financial Statements. Even some of the most seasoned cost accountants are flummoxed with how the manufacturing information is represented in Financial and Management Accounting, and how to measure price and efficiency variances. To put it simply, Production Variance Analysis involves three steps:
Creating a standard cost estimate, which calculates the expected cost to manufacture an assembly.
Collecting the Actual manufacturing costs on a manufacturing order (production order/process order /product cost collector).
Calculating the Variance, which is the difference between:
actual costs: components, labor, overhead
actual credits: value of finished goods manufactured.
In the standard ERP system (and even S/4HANA) it is difficult to find reports that give you a multidimensional view of your inventory costs. Many customers download the information to Microsoft Excel or use external reporting tools such as BI to do the analysis. There is nothing wrong with these options, but sometimes they lead to reconciliation errors (in the case of Excel) or realtime update issues (in the case of BI). With the Material Ledger Activated and by utilizing an enhanced report, there are several reporting options that will give you a more granular view of your inventory values.
Stock-in-Transit can occur when goods transferred between two entities have left the sending entity, but ownership has not yet been transferred to the receiving entity. In traditional SAP the Stock-in-Transit of Inventory can be identified in Inventory Management reports, but this is not reflected in Accounting. With the Business Function LOG_MM_SIT, which is available in ECC (from Enhancement Pack 5) and also in S/4HANA (switched on by default), you can reflect the Stock-in-Transit in dedicated G/L Accounts.
As of ECC 6 EHP 5, SAP rolled out a functionality which allows for reorganization of the profit center on the core SAP objects in the Logistics and Accounting functions.
This includes changing profit centers on Materials, Sales Orders, Cost Centers, Orders, Projects, AR, AP, and GL Open Items. With this functionality companies can update the core data in their SAP ERP systems to enable financial reporting which better aligns with how they manage their business today versus 10-15 years ago when they first implemented SAP. Learn how SPX Flow used this functionality to transform their financial reporting and enable full financial statements which align with a new management structure.
SAP provides mainstream maintenance for core applications of SAP Business Suite 7 software including SAP ERP 6.0, SAP Customer Relationship Management 7.0, SAP Supply Chain Management 7.0, and SAP Supplier Relationship Management 7.0 applications and SAP Business Suite powered by SAP HANA on the respective latest three Enhancement Packages (EhPs) until December 31, 2027. From January 1, 2028, all SAP Business Suite 7 core applications and respective SAP Business Suite 7 add-on products will enter the customer-specific maintenance (CSM) phase. SAP offers an optional extended maintenance phase from January 1, 2028, until December 31, 2030. This three-year phase comes at an additional fee on top of the maintenance fee. Details outlined in SAP Note 2881788.
Cost Allocation within the Overhead Cost Controlling module enables business users to periodically allocate posted amounts and quantities from sender cost objects to receiver cost objects based on a Cycle Structure. Some challenges exist with the current ECC functionality such as the ability of users to easily understand their allocation processes and the ability to simulate the results from allocations. Also, several other modules such as General Ledger, Profit Center Account, and Profitability Analysis also contain allocation functionality, but it is difficult to keep track of all the allocations, as they are not stored in the same area of the system. In S/4HANA 1809, Universal Allocations were introduced to handle most of these issues as well as provide new functionality.
The FASB released new lease accounting standards taking effect:
- After December 15, 2018 for US public companies and
- Delayed to December 15, 2021 for US private and nonprofit companies*
- Lease contracts move from a footnote in financial statements to the balance sheet as right-to-use (ROU) assets
- SAP's existing Real Estate module (RE-FX) incorporates the new process and reporting requirements
- This webinar informs you of 5 things you may not know, but should, about implementing the new lease accounting standard and SAP's RE-FX solution:
- Things to do before your implementation
- Things to avoid that complicated public company
implementations
- S/4HANA versus ECC6 and on- premise versus
cloud
- Things to remember about SAP's RE-FX
configuration
Data archiving is not a new concept as organizations use it to manage the database volume to manage SAP footprints. As S/4HANA architecture, where the database is already a columnar database for a robust and fast performance of reporting/transactions, why are we discussing data archiving now? There can still be organizations with a very high data footprint and looking for archiving old data, especially for clients who converted their old SAP system to S/4HANA and thus may carry the legacy data if not archived before moving to S/4HANA.
The Embedded Analytical tools may be divided based on usage. CDS Views are the foundation for all analytical applications. Programmers create a virtual data model using CDS views. In comparison, the key user uses CDS views to create dashboards. "Custom Analytical Queries" will be used to develop customer queries. Finance and Logistics end users. Use reports and dashboards created by the key user. Functional users will use SAP Smart Business Cockpits with predefined content for different multidimensional reports across all business lines.
Some multidimensional reports provide to end-users through SAP Fiori. They have flexible slice-and-dice navigation features. "Query Browser" will help end-users for analytic queries that allow them with flexible slice and dice reporting. "View Browser" is another tool to check the delivered CDS Views and Queries. These tools help the Functional team ( Finance, Logistics, ………… users) to get reports with no latency, no data duplication, excellent performance for all types of reports, Integration scenarios with SAP BW, and also Support for SAP ERP authorizations.
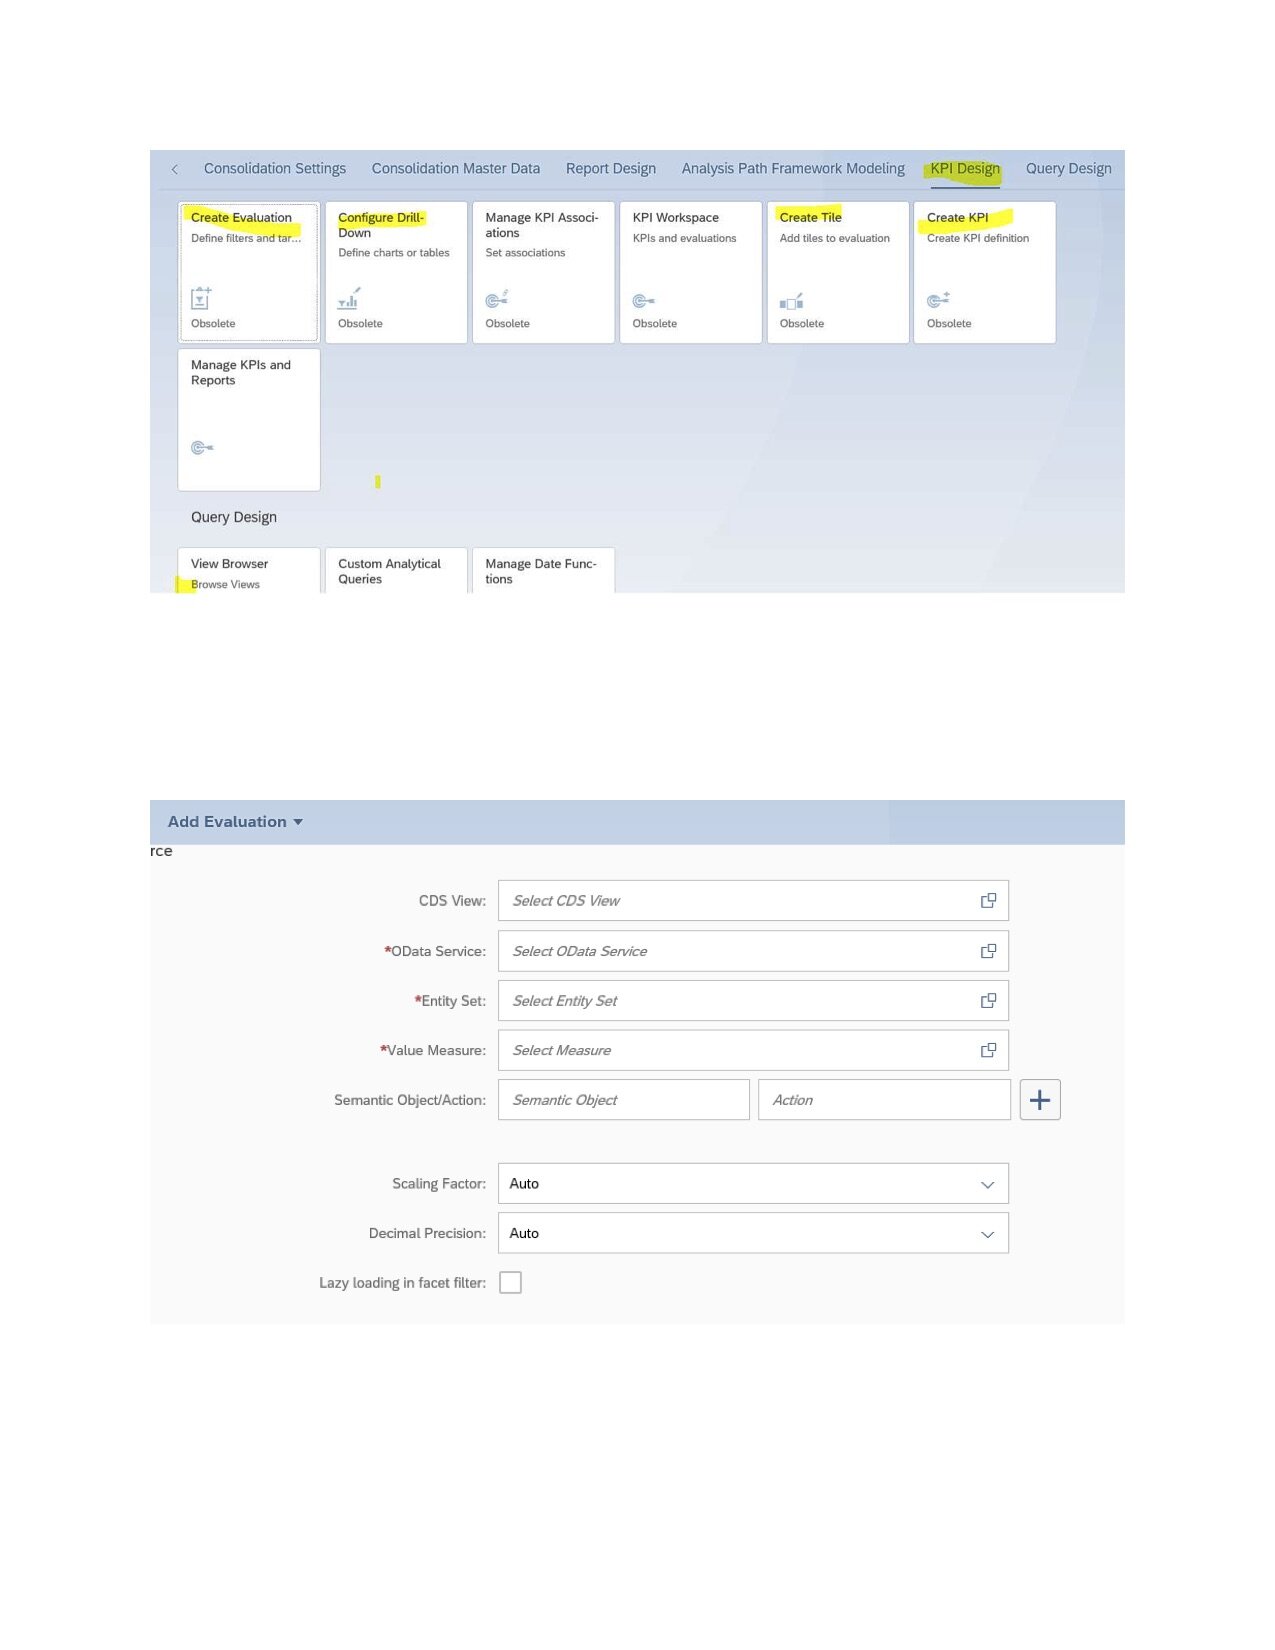
1. Report Design Modeler — Apps
*See picture 1 labeled below
The Report Design Modeler apps are a set of SAP Fiori apps that customers can use to create and manage Financial or Logistics or any other reports. When created an evaluation, we choose a tile to visualize the reports in the Publish Report app.
*See picture 2 labeled below
You define this using the Configure Report Drill-Down app.
*See picture 3 labeled below
Business knowledge helps to configure the drill-down views. Configure Report Drill-Down app is used by power users who can see data in Graphs IT administrative knowledge is needed to authorize users to get access to these reports
You may use this capability for all most all Finance reports like:
Analyze Actual Cash Flow, Liquidity Forecast, Budget Alerts, Contract Expiry, Aging Analysis,
Analyze Change Impact, Analyze Collections Success, Analyze Collections Volume, Analyze Credit Exposure, Analyze Open Credits, Analyze Overdue Items / Overdue Item Analysis, Analyze Payment Locks, Analyze Payment Run Exceptions, Cash Discount Utilization, Cash Discount Forecast, Cash Collection Tracker - Accounts Receivable, Cash Position, Analyze Returns, Operational Supplier Evaluation / Supplier Evaluation, Payment Statistics, Credit Limit Utilization, Days Payable Outstanding Analysis,
Days Sales Outstanding, Detect MRP Situations, Future Receivables, Future Payables……….Etc.
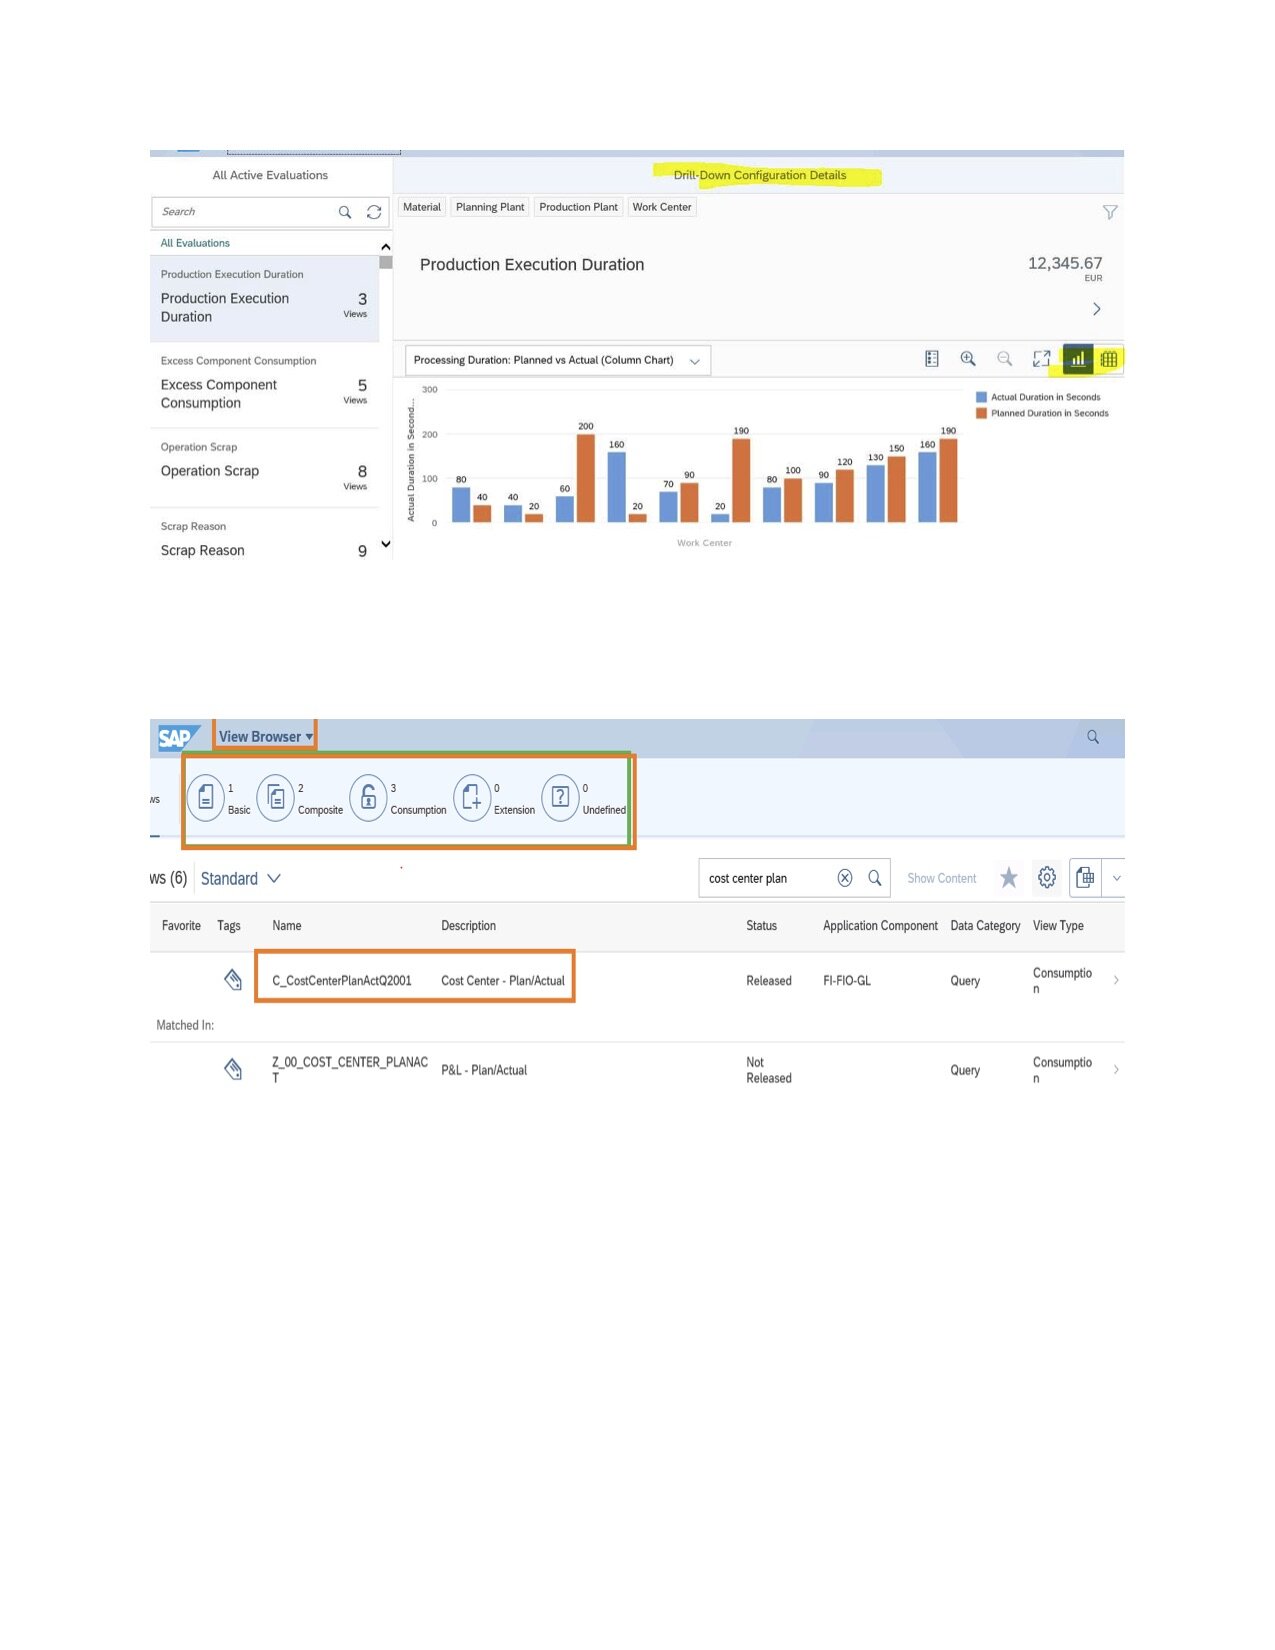
2. Overview of View Browser and Query Browser
The View Browser
View browser allows Power users from all business lines to explore thousands of VDM views without any technical skills. So, it helps Business Users to draw meaningful reports for their business requirements. You can find suitable views based on your need and display its content for analytical queries in Design Studio. Using View Browser, we can explore standard Core Data Service views (Composite and Consumption) and create developers.
+
*See picture 4 labeled below
The Query Browser
The Query Browser is a default Design Studio app that is available in the standard SAP Fiori Library.
The Query Browser is not part of the SAP Fiori launchpad's default view and is added to the My Home group. The Query Browser will show consumption views that were annotated as Analytical Query and therefore act as a source for KPIs. Users can select an Analytical Query and perform on-demand reporting on it.
The Query Browser is a default Design Studio app available in the standard SAP Fiori Library. No additional installation is required.
In the Query Browser, you can see many analytical queries.
*See picture 5 labeled below
Business catalog SAP_CA_BC_VDM is to assigned to the user.
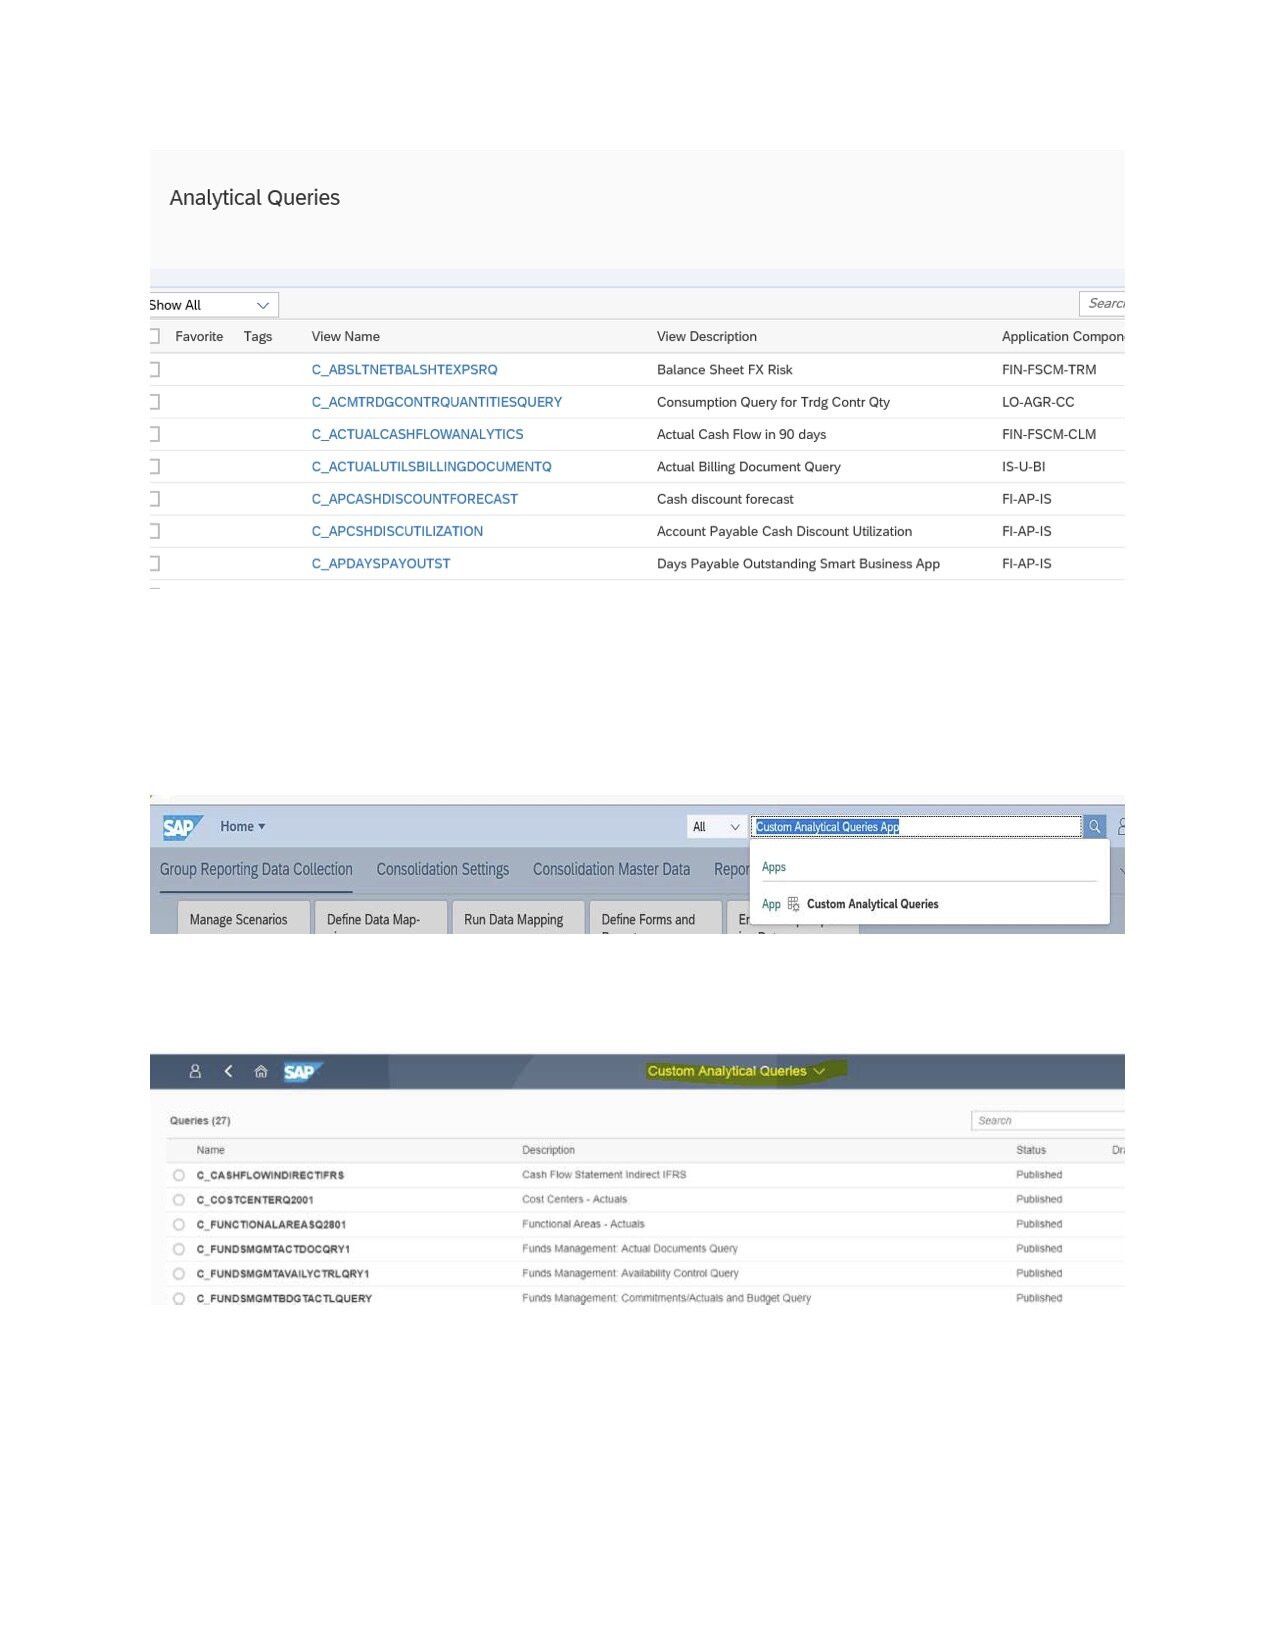
3. Custom Analytical Queries app
For creating Financial or Logistics or a report that is needed from any business line, from scratch, SAP provides the built-in, easy-to-use, Custom Analytical Queries app. It is aimed at key users, rather than end-users. An advantage of it is that you don't have to understand the query language to build a query.
*See picture 6 labeled below
Required Business Role: SAP_BR_ANALYTICS_SPECIALIST
Required Technical Catalog: SAP_BASIS_TCR_T
Activated ICF node: ANA_QDESIGN_MAN (ICF path /sap/bc/ui5_ui5/sap/ana_qdesign_man)
Example: Power-user wants a report from Cost Center Module.
Customers can create a Custom Analytical Query to report in Cost Center Module on Actual Vs. Plan data. We can also have a drill-down facility
*See picture 7 labeled below
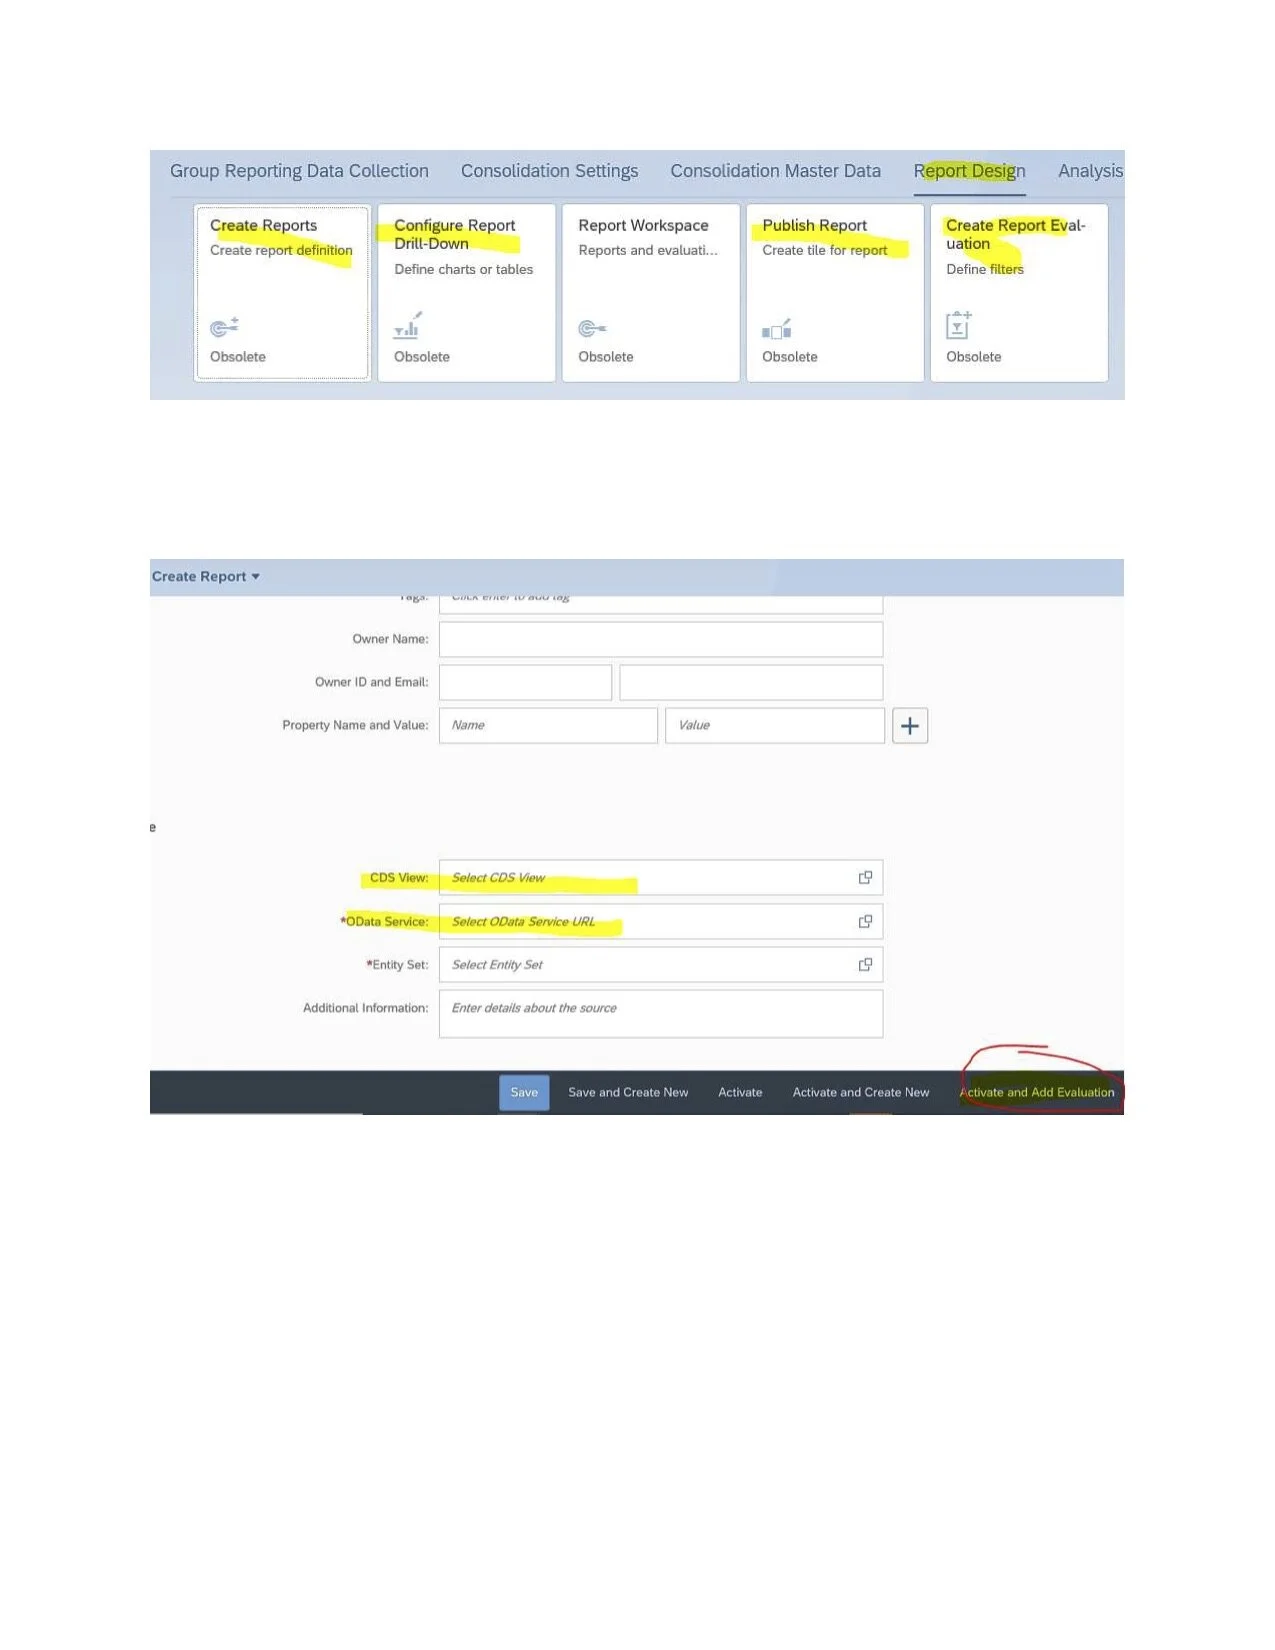
4. The Report Designer Modeling apps
The Report Designer Modeling apps are a set of SAP Fiori apps that a key user uses to define or manage reports.
*See picture 8 labeled below
These Reports are based on the Analytical List Page Smart Template.
Customers can Create Reports using create report app based on measures of the related Analytical Query.
Just enter the relevant data source details such as the Core Data Services (CDS) view, the OData service path, and the entity set that corresponds to the CDS view.
*See picture 9 labeled below
Choose Activate and Add Evaluation.
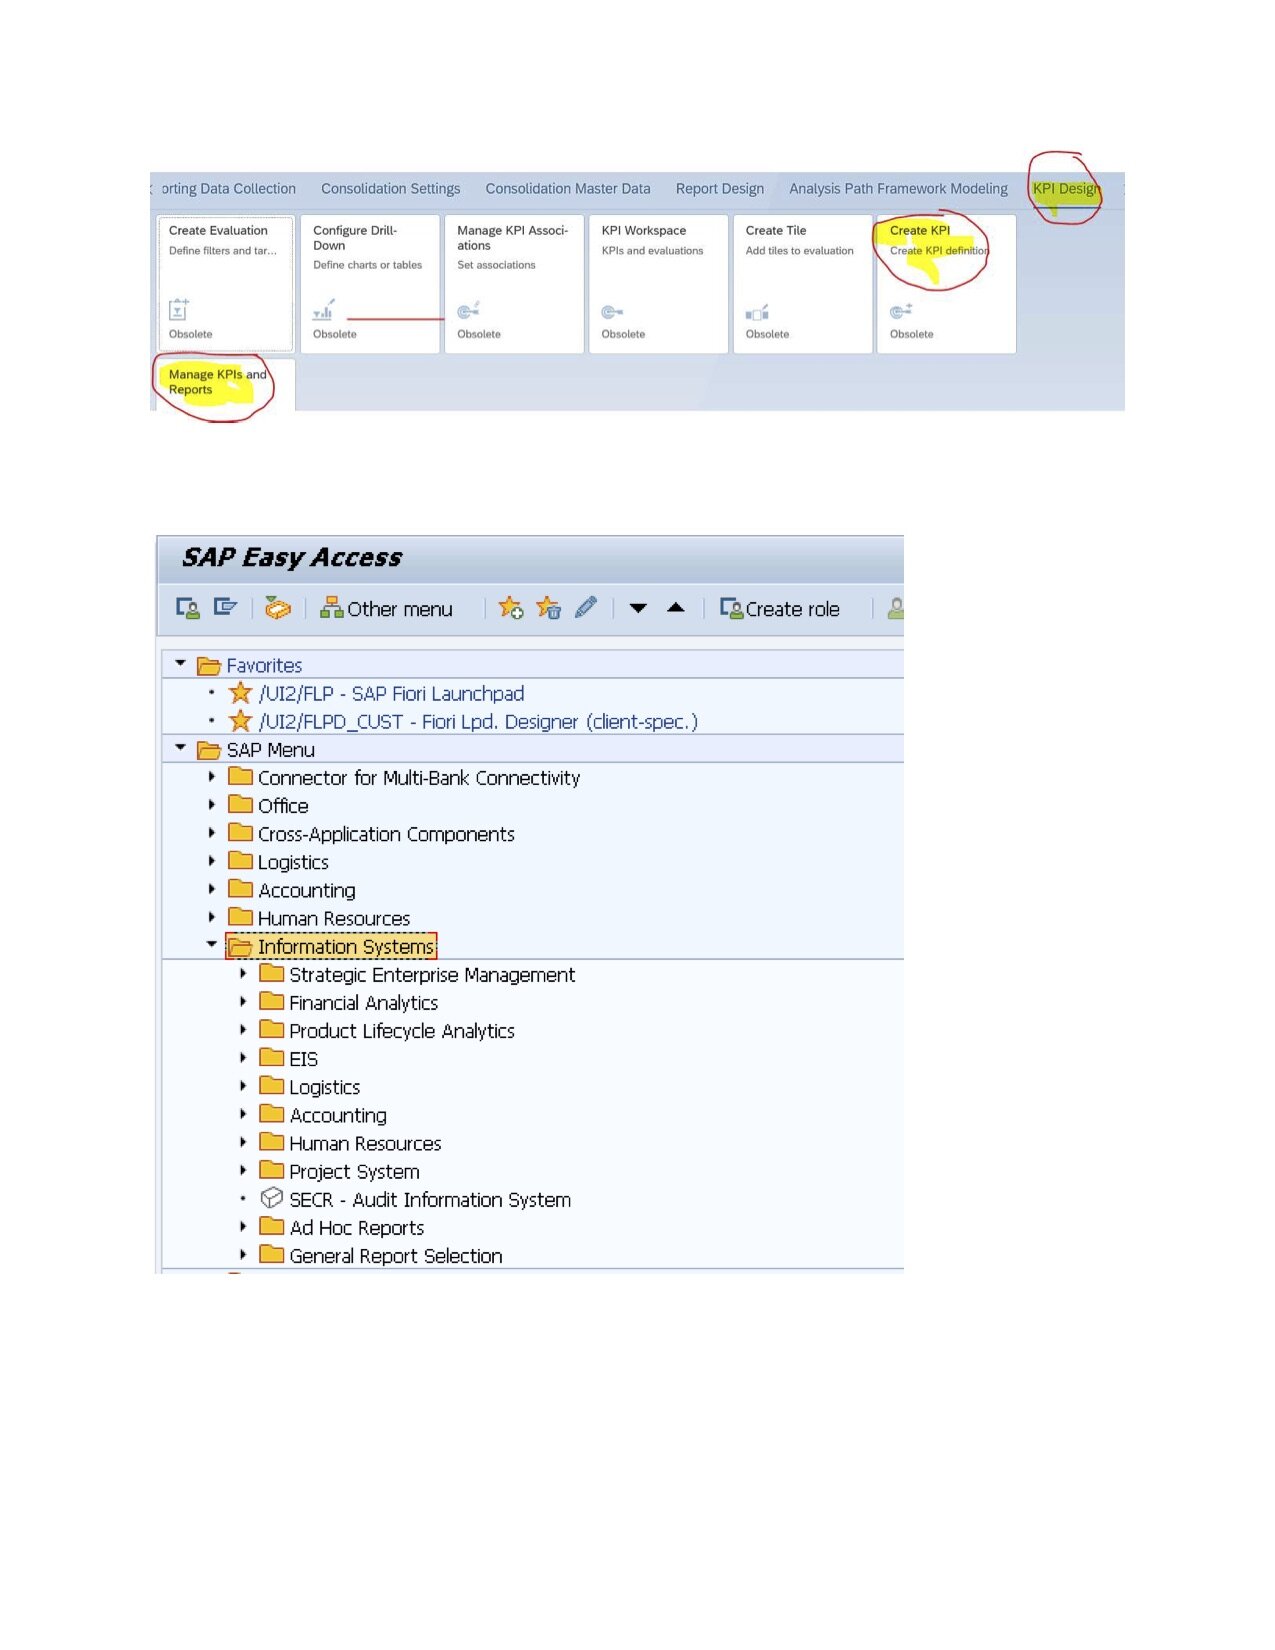
5. The KPI designer - Smart Business Framework
SAP Fiori Smart Business helps customers create their analytical apps based on Key Performance Indicators (KPIs).
*See picture 10 labeled below
Smart Business Cockpits can be personalized. They bring analytics into the business process when the user needs it. Customers can develop an Analytical Query to analyze business data using the KPI Designer tool.
You can create a KPI, in the following order:
· Create KPI
· Create Evaluation
· Create Tile
· Configure Drill-Down
· Manage KPI Associations (optional)
6. SAP Analytics UIs
SAP Analysis for Microsoft Office is a Microsoft Office Add-In that allows multidimensional Analysis When you install Analysis for Microsoft Office on your local machine; you can connect directly to the following:
SAP Business Warehouse (BW) system
SAP Business Objects Business Intelligence (BI) Platform
SAP HANA
Using Analysis for Office, you can also access Core Data Services view based queries and view the report.
7. SAP delivers several standard reports.
You can find these reports at various locations under the Information System in the SAP Easy Access menu.
*See picture 11 labeled below
Almost every application in the system has an Information System menu option, which contains the reports predefined by SAP. You can also display thru SE43.
*See picture 12 labeled below
You can search standard reports in SE38, by the letters they contain. For example,
Vendor related reports can are found by RFK*
Customer-related Reports can be searched by letter RFD*
General ledger RFS*
Document Reports: RFB*

There are certain scenarios where the activities of a business are not aligned with the period when the costs for those activities are incurred. This occurrence is typical with companies with seasonal production cycles, such as those in the Agribusiness industry, whose investments in land or other resources, do not always coincide with when the utilization of those resources occurs. In those cases, a cost model is set up so that the original cost is spread through the periods of the production cycle, when the actual cultivation of the land takes place.
In these times, where disruption due to COVID 19 has impacted many industries and hence production activities, the model described above could also be useful. During periods of Production Downturn which leads to minimal or no activity, how do you reflect that in a cost structure that had assumed that production will take place? Hear from Rogerio Faleiros, SAP Controlling Expert and Author, who will take you through the following:
- Using Assessments between Cost Centers and Internal
- Orders for Operational Expenses
- Using Internal Order Settlement to transfer Costs to AUCs
- Setting up Depreciation Rules to reflect periods of Uneven
Production
- Using the Allocation Structure to Distinguish Between
- Different Types of Costs
SAP Central Finance (CFIN), every large organization is thinking/talking about it is one or another way! It quickly gives the S/4HANA value benefits without necessarily disrupting existing processes. In such CFIN projects, there is a mandatory step for the initial load, even if you do not want to migrate the historical data from the legacy system to the SAP Central Finance system.


